 LD2/4) ... (1)
avd Konstruktionsteknik
Field investigation.
Lennart Fransson and Lars Ĺström, Luleĺ University of Technology, Sweden
Jan-Erik Lindholm, Helsinki University of Technology, Finland
The field program was carried out in cooperation by Luleå and Helsinki University of Technology from the Finnish research vessel RV Aranda. The aim of this report is to present representative strength data at the given ice situation to be used in ice force calculations.
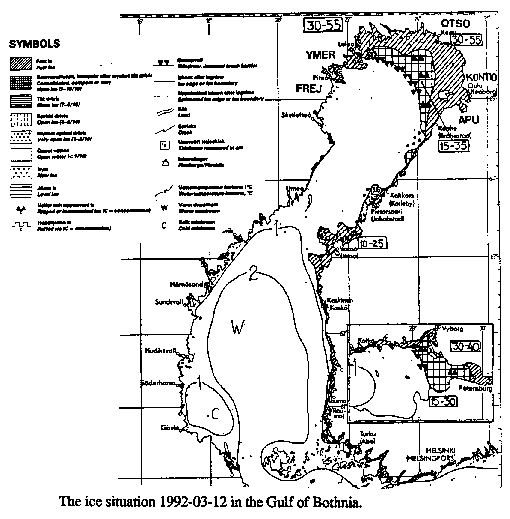
Strength data on brackish ice from the Gulf of Bothnia, measured with similar technique, have earlier been published (Fransson, 1987),(Fransson et.al., 1990). This report provides new information about soft warm ice measured immediately before ice ridging. Strength data and more results from the field study such as pressure ridge data can be found in the report "Field measure-ments of Northern Baltic pressure ridges." by Reynolds and Lindholm (1992). See map on the ice situation 1992-03-12 in the Gulf of Bothnia.
Uniaxial compression tests were carried out with a small but stiff loading machine on 70 mm cylindrical specimen. The loading machine was operated by a manual hydraulic pump on which each stroke moved the indentor 0.6 mm. A typical speed of 1 stroke per second was used but the effective indentation speed was reduced by the deformation of two 4 mm rubber pads at the interfaces. The time to failure was in most cases within the range 5-10 seconds.The ice was often very porous and sometimes large pores totally sabotaged the strength. Even though the ice was weak it was brittle and the peak load was limited by instability of the sample. The measured peak load divided by the cross sectional area is presented as the uniaxial compressive strength at a specified field station and ice depth.
In the central part of the station pressuremeter tests were carried out in order to get a rough approximation of the in-situ compressive strength. In the pressuremeter tests the ice cover was drilled through with a 60 mm ice auger. Then a rubber membrane was placed in the bore-hole and expanded with a liquid until the ice was locally crushed. The tests were usually carried out at six spots only a few meter from each other. The result can therefore be considered as an average index strength of a relatively large volume of ice. In Figure 1 the pressuremeter test set up is shown.
Table 1.
---------------------------------------------------------------------------
 Date     Field         GPS       Air Temp    Wind Speed    Ice Conditions
March    Station     Position      °C          m/s             h = ice
 -92                             High   Low   High    Low      thickness
---------------------------------------------------------------------------
  10        -            -       +4.0   +0.7  14.9    6.7     open water
  11        -            -       +1.1   -0.3  16.3    6.4    brash barrier
  12       A, B     65:23.97 N   +0.5   -2.8  19.7    4.9    consolidated
         Malören    23:34.22 E                              floes h=40-60cm
  13        C       65:24.86 N   +0.4   -0.6  18.2    4.2    level ice and
         Malören    23:31.39 E                               ridges h=12cm
  14    D  Malören  65:15.08 N   -0.5   -2.9  12.8    0.5   ice floe h=80cm
                    23:34.40 E                              with 10 cm snow
  15    D  Malören  65:15.08 N   -1.1   -5.5   7.7    0.8   as 14/3 with 5
                    23:34.40 E                                 cm slush
  16        E       65:02.32 N   -0.5  -10.6   7.1    1.3       landfast
        Marjaniemi  24:32.67 E                              snow-ice h=70cm
  17        F       65:24.98 N   -0.7   -5.4  15.1    5.5   ice floe h=45cm
         Malören    23:34.81 E                              with 5 cm slush
  18     Malören    65:24.06 N   +0.3   -1.4  17.7    5.4     level ice,
                    23:34.05 E                              ongoing ridging
---------------------------------------------------------------------------
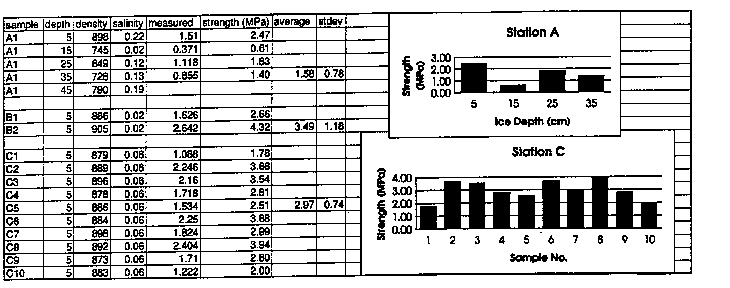
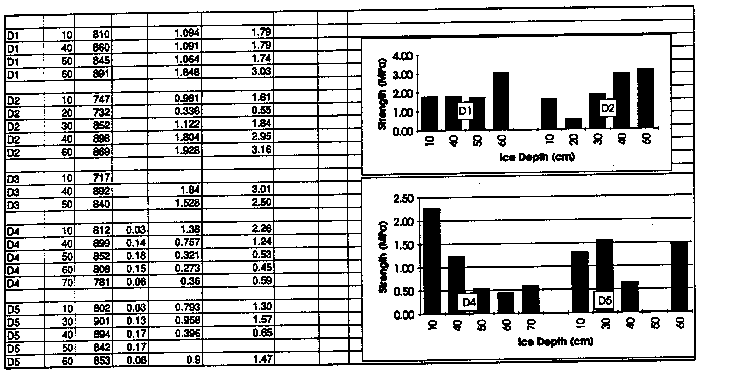
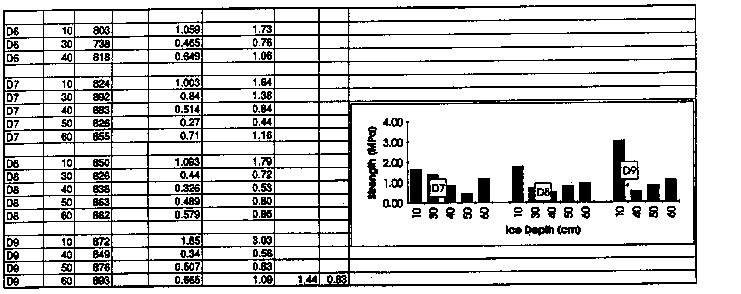
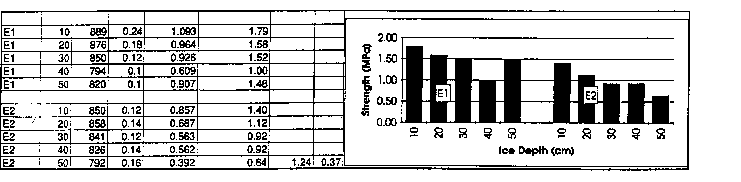
Figure 3 shows ice depth vs. horizontal strength for all tested samples. The thinner ice (B and C) was stronger with an average strength of 3.0 MPa. In general the top layer was stronger than average. The depth dependency was however masked by the large scatter. All the basic data is given in more detail in appendix.
Table 2.
---------------------------------------------------------------------------
Station     Ice    Test   Pressuremeter  Pressuremeter  Uniaxial
          Depth   Depth     Strength     Strength/2.5   Strenght
           (cm)    (cm)       (MPa)          (MPa)       (MPa)
---------------------------------------------------------------------------
   A        50      20         3.2            1.3         1.8
          +/- 8     35         2.5            1.0         1.4
   B        25      10         4.8            1.9         3.5
          +/- 7
   D        78      20         1.7            0.7         0.55
          +/- 3     40         2.6            1.0         1.51
                    60         3.7            1.5         1.61
   F        44      20         2.5            1.0         1.85
          +/- 4
---------------------------------------------------------------------------
= M / (LD2/4) ... (1)
where M is weight, L is length and D is diameter of the specimen. Using the measured density the porosity p was defined
p = 1 -  /
/ ... (2)
where is the density of pure ice (= 920 kg/m3).
Salinity of the water of melted samples was estimated from conductivity measurements in room temperature. The low salinity (0.02 - 0.2 o/oo) and the ongoing melting in the field made the salinity measurements inaccurate and consequently calculations of brine volume would be misleading. In melting conditions tubular voids may be water filled which also affects the porosity measurements. In Figure 8 porosity and salinity profiles at different stations are shown.
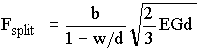 ... (3)
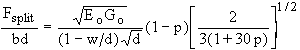
where b and d are the cross section dimensions and w/d is the effective contact width at the loading face of the specimen. E is the elastic modulus and G is the fracture surface energy. The porosity dependence of elastic modulus in brittle solids has been analysed by Krstic and Erickson (1987) based on crack opening displacement. A round specimen with spherical pores will according to Krstic and Erickson have the effective modulus
 ... (4)
where Eo is elastic modulus for pure ice, p is porosity,  is Poisson's ratio
and s/R is a relative crack length close to a spherical pore. In ice the shape
of a newly formed air bubble has an elongated form which later tend to be more
spherical. Therefore it is reasonable to assume a crack length of the same
order as the bubble radius. With s/R = 1 and = 1/3 in Eq. (4) we obtain
is Poisson's ratio
and s/R is a relative crack length close to a spherical pore. In ice the shape
of a newly formed air bubble has an elongated form which later tend to be more
spherical. Therefore it is reasonable to assume a crack length of the same
order as the bubble radius. With s/R = 1 and = 1/3 in Eq. (4) we obtain
E/Eo = (1-p)/(1+30p). ... (5)
Fracture energy is usually scaled linearly with the fractured area which perpendicular to cylindrical bubbles results in
G/Go = 1-p. ... (6)
In the case of large pre-existing cracks in the fracturing direction also s/R will have an influence on the fracture energy. It is not obvious how the shape of the air bubbles should be included in the formula and therefore Eq. (6) is applied even for our spherical bubbles. A substitution of Eqs. (5) and (6) into Eq. (4) results in a porosity dependent effective pressure of
 ... (7)
In the linear fracture mechanics theory
 is equal to the critical stress intensity Kic which is experimentally evaluated
for sea ice from the Gulf of Bothnia. In our case Kic = 100 kPa m1/2
is a possible value for pure granular ice, Stehn (1990). With almost constant
sample dimensions l/D = 2.4 the relative contact width is considered as
constant w/d = 0.9. Equation (7) is then rewritten
is equal to the critical stress intensity Kic which is experimentally evaluated
for sea ice from the Gulf of Bothnia. In our case Kic = 100 kPa m1/2
is a possible value for pure granular ice, Stehn (1990). With almost constant
sample dimensions l/D = 2.4 the relative contact width is considered as
constant w/d = 0.9. Equation (7) is then rewritten
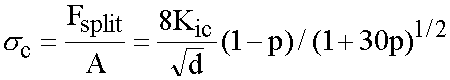 ... (8)
where c is the uniaxial "compressive strength" which as well could be named
"splitting strength". Using Kic = 100 kPa m 1/2 and d =
D = 0.07 m results in a strength of  = 3.0 MPa. This is a relatively low value which indicate that the relative contact
width may be greater than 0.9. In this early stage of the use of Eq. (8) there
is no meaning in adjusting w/d just to get a better fit. In Figure 9 measured and calculated strength is plotted as a function of porosity.
= 3.0 MPa. This is a relatively low value which indicate that the relative contact
width may be greater than 0.9. In this early stage of the use of Eq. (8) there
is no meaning in adjusting w/d just to get a better fit. In Figure 9 measured and calculated strength is plotted as a function of porosity.
A falling trend can be traced even though the strength of low porosity ice was very scattered. One important reason for that may have been that mixed ice types with different degree of deterioration was involved.
The size distribution of air bubble inclusions is not considered in the proposed formula. Large bubbles will have a dramatic influence of the density but not necessarily on the strength. Small bubbles and elongated bubbles play a more important role if they form weakness plane. Therefore it makes sense to analyse the air bubble distribution and at least separate cylindrical bubbles from spherical. In many cases the air bubbles are closely linked to the actual ice type but at warm temperatures the patterns will change rapidly from cylindrical towards spherical.
The testing procedure worked well although the ice was in a melting condition. When the ice was tested immediately after sampling on board the ice-breaker the result was consistent with those from the in situ testing. In most situations in situ testing seem to be good enough to classify ice strength if also salinity, density and temperature is measured. When strength tests are performed on small porous samples, mapping of the pore geometry of each sample is motivated.
The use of a video-camera for examination and documentation of crystal structure and pore geometry worked smoothly. Even though the quality of prints was poor it was a practical complement to ordinary photos.
Fransson, L. (1987) Horizontal compressive strength of low salinity ice from the Gulf of Bothnia. Proceedings from the 9th Int. conf. on Port and Ocean Engineering under Arctic Conditions (POAC-87), Fairbanks, Alaska, Vol. III, pp 21-29.
Fransson, L., Håkansson, B., Omstedt, A. and Stehn, L. (1990) Sea ice properties studied from the icebreaker Tor during BEPERS-88. Rep. SMHI RO No. 10, Norrköping Sweden, 20 p + 3 attachments.
Kendall, K. (1978) Complexities of compression failure. Proc. Royal Society of London. A 361, pp 245-263.
Krsic, V. D. and Erickson, W. H. (1987) A model for the porosity dependence of Young's modulus in brittle solids based on crack opening displacement. Journal of Materials Science No. 22, pp 2881-2886.
Michel, B. C. (1983) Final report - Development of a field technique to measure the in situ crushing strength of ice, Phase II. Report to Marine Aids Civil, Transport Canada, 66 p. + 6 annexes.
Reynolds, E. and Lindholm J-E. (1992) Field measurements of Northern Baltic pressure ridges. Rep. M-19, Arctic Offshore Research Centre, Helsinki University of Technology, 32 p.
Stehn, L. (1990) Fracture toughness of sea ice - Development of a test system based on chevron notched specimen. Licentiate Thesis 1990:11L. Division of Structural engineering, Luleå University of Technology, 88 p.
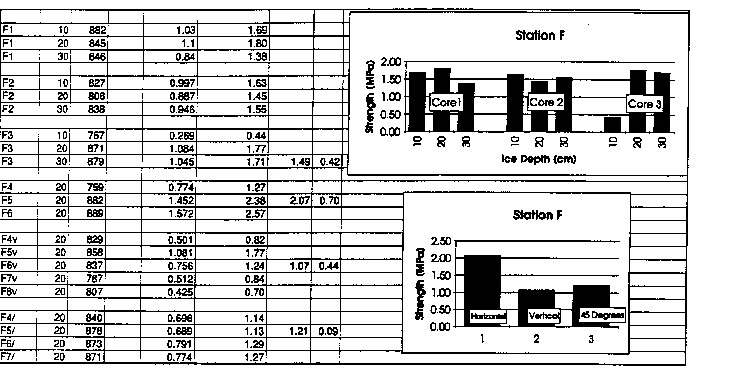
The data is given in the following units:

depth     density     salinity     measured load     strength
(cm)      (kg/m3)      (o/oo)         (V)             (MPa)
Average strength and standard deviation for each station A-F is given in the two last columns. The identification of a single horizontal sample is given by Station-No and depth from the ice surface in cm (e.g. sample D2-30 with a strength of 1.84 MPa). The presented strength was obtained from uniaxial loading tests on cylindrical specimen with a diameter of 70 mm and a height varying from 160 to 177 mm. The temperature of the specimen was close to the melting point 0 °C.